spherical spacewar
graphs for notes on spherical spacewar
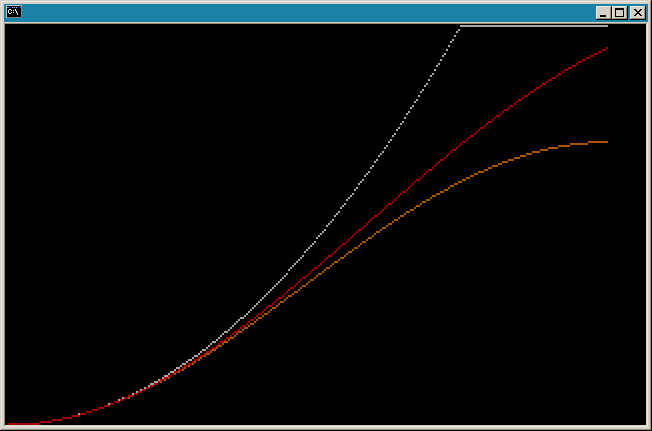
Graph 1. Spin moment of inertia for a spherical shell cap of constant mass (spin about an axis normal to the sphere at the surface center of the cap) as a function of unit sphere central angle radius (0 to 90 degrees on the x-axis), shown in red. The gray and orange lines are the corresponding spin moments of inertia for a flat disc of the same radius and the sine of that radius.
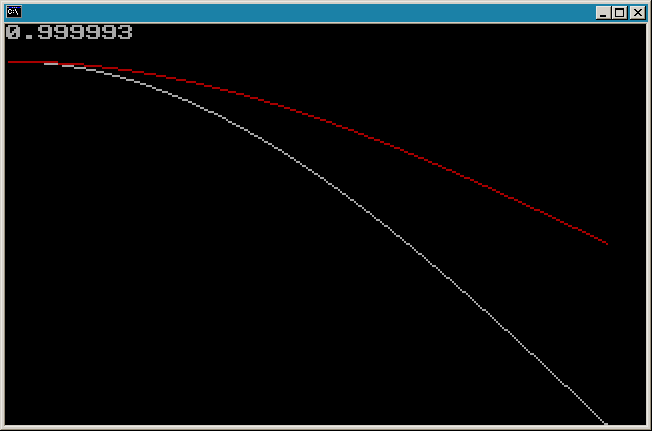
Graph 2. Distance of the center of mass of a spherical shell cap from the sphere center, shown in red, as a function of unit sphere central angle radius (0 to 90 degrees on the x-axis). The gray line is the distance of the center of the bottom circle of the cap from the sphere center.
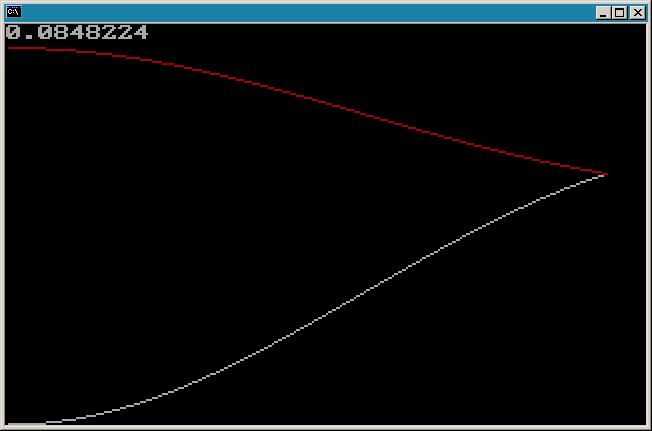
Graph 3. The moments of inertia of a spherical shell cap of constant mass as a function of unit sphere central angle radius (0 to 90 degrees on the x-axis). The gray line is the moment of inertia for spin about an axis normal to the sphere at the surface center of the cap, and the red line is for rotation along the sphere surface about the center of the sphere.
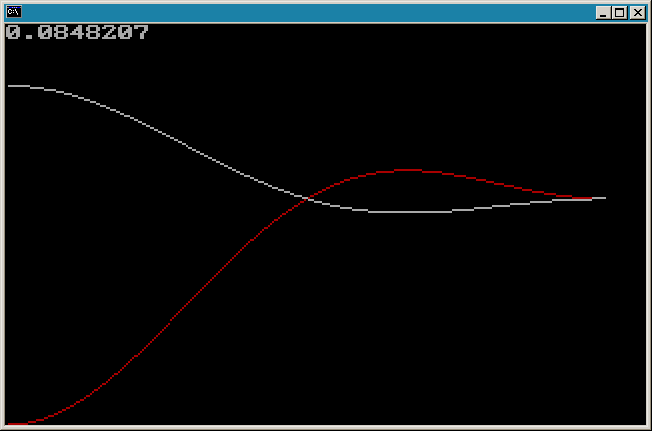
Graph 4. The moments of inertia of a spherical shell cap of constant mass as a function of unit sphere central angle radius (0 to 180 degrees on the x-axis). The red line is the moment of inertia for spin about an axis normal to the sphere at the surface center of the cap, and the gray line is for rotation along the sphere surface about the center of the sphere.
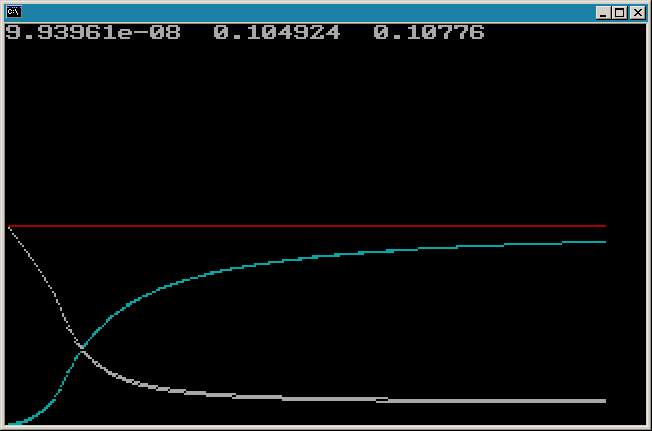
Graph 5. Friction against spin (gray) and friction against travel (cyan) for constant travel velocity and as a function of spin rate (plotted on the x-axis). Superimposed similar plots for a surface cap of central angle radius 0.084823 on a unit sphere and for a flat disc on a plane. Friction magnitudes shown are negative and of greater magnitude lower on the page. Friction is plotted as force of friction divided by the mass of the object or as torque of friction divided by moment of inertia and times the average radius from the spin axis.
At low spin rates, friction against spin is suppressed by the travel velocity, and at high spin rates friction against travel is suppressed.
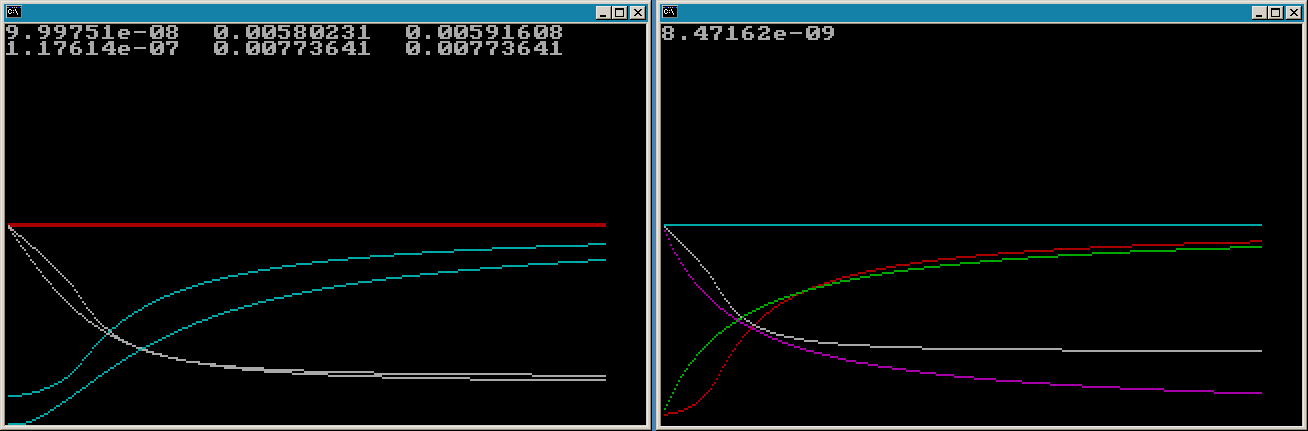
Graphs 6_1 and 6_2.
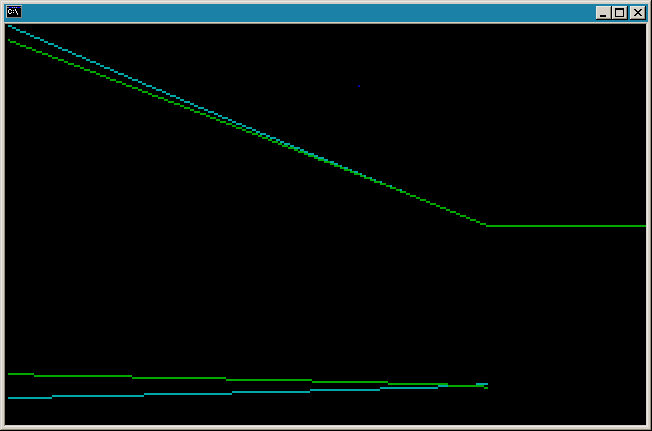
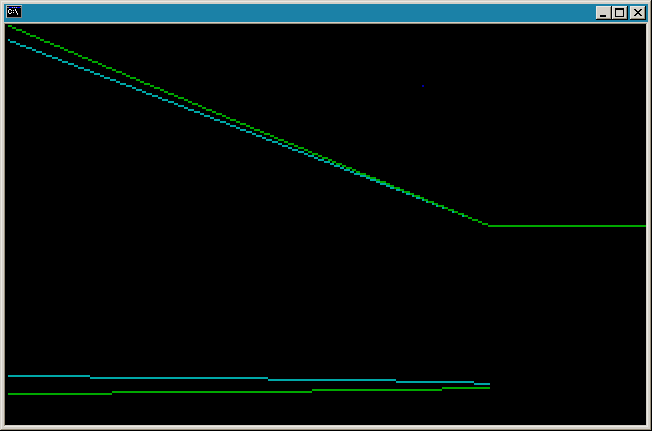
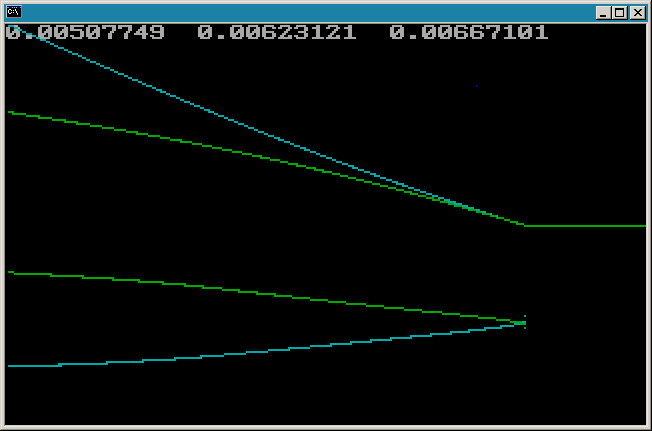
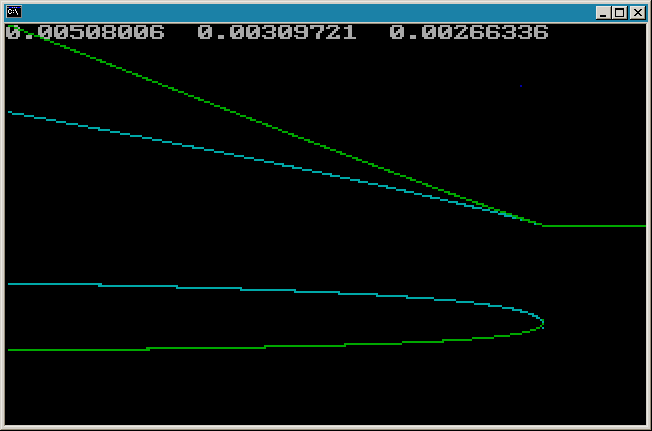
Graphs 7, 8, 9, and 10. Above the center, travel velocity is plotted in cyan, and spin velocity times average radius from the spin axis is plotted in green. Below the center, friction against travel is plotted in cyan, and friction against spin is plotted in green. All are plotted as a function of time, along the x-axis. Friction is plotted as force of friction divided by the mass of the object or as torque of friction divided by moment of inertia and times the average radius from the spin axis. Friction magnitudes shown are negative and of greater magnitude lower on the page. All four graphs show data for a disk on a plane, and Graphs 9 and 10 superimpose similar data for a surface cap of central angle radius 0.084823 on a unit sphere. Graphs 9 and 10 depict higher initial velocities, and the horizontal scale is 5/4 more time per unit, and the vertical scale is 508/310 more per unit, than for Graphs 7 and 8. A blue dot is plotted near the top of each graph at the point in time when travel velocity and spin velocity scaled by average radius about the spin axis are first within an epsilon of each other.
up home